안녕 Peerlysters,
이 기사에서는 "Wazuh"라고 불리는 강력한 HIDS를 어떻게 배치하는지에 대해 알아보려고 한다.

침입 탐지 시스템이란?
침입 탐지 시스템은 침입과 악의적인 활동으로부터 방어하기 위해 현대 조직에서 큰 역할을 하는 장치나 소프트웨어의 집합이다.침입 탐지 시스템 범주는 크게 두 가지,
- HIDS(Host Based Intrusion Detection System): 엔터프라이즈 호스트에서 실행되어 호스트 공격을 탐지함
- NIDS(Network Based Intrusion Detection System): 이들의 역할은 인바운드 및 아웃바운드 트래픽을 모니터링하여 네트워크 이상을 탐지하는 것이다.
탐지는 다음과 같은 두 가지 침입 탐지 기술을 사용하여 수행할 수 있다.
- 서명 기반 탐지 기술: 트래픽을 알려진 위협의 서명 데이터베이스와 비교
- 이상 징후 기반 침입 기법: 활동의 동작을 기준으로 트래픽을 검사한다.
Wazuh HIDS 배치 방법?

공식 웹사이트에 따르면: https://wazuh.com
Wazuh는 위협 탐지, 무결성 모니터링, 사고 대응 및 컴플라이언스를 위한 무료 오픈 소스 및 엔터프라이즈급 보안 모니터링 솔루션이다. Wazuh는 보안 데이터를 수집, 집계, 색인화 및 분석하는 데 사용되며, 조직에서 침입, 위협 및 행동 이상 징후를 탐지할 수 있도록 돕는다.
Wazuh는 보안 데이터를 수집, 집계, 색인화 및 분석하는 데 사용되며, 조직에서 침입, 위협 및 행동 이상 징후를 탐지할 수 있도록 돕는다.
여기에는 다음과 같은 구성 요소가 포함되어 있다.
- 와주 서버
- 탄성 스택
- Wazuh agent
Now let's explore how to deploy it. For the demonstration i am using a Ubuntu 18.04 VM.
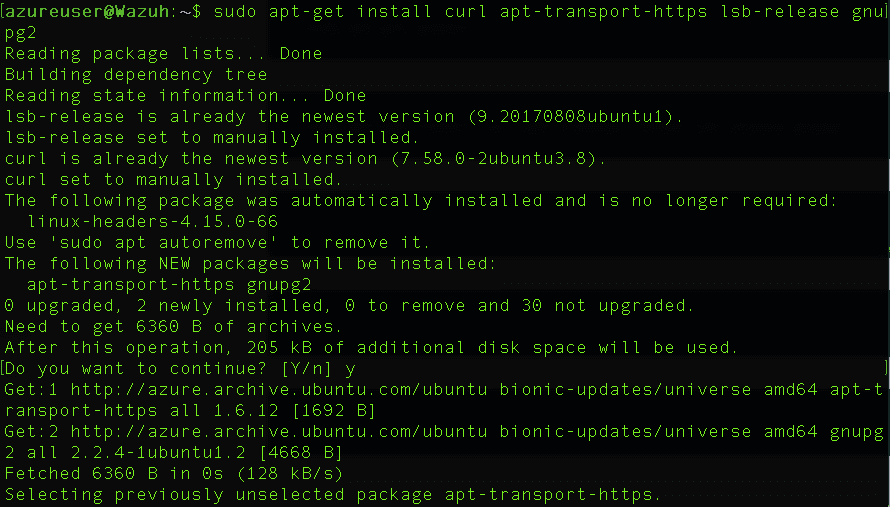
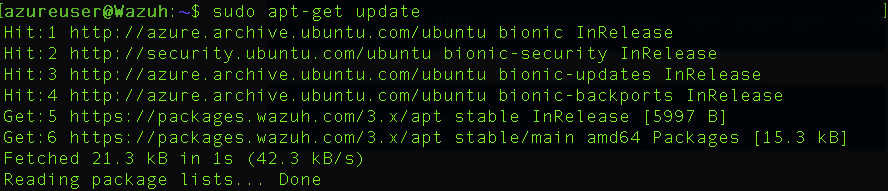
sudo apt-get update
sudo apt-get installcurl apt-transport-https lsb-release gnupg2

GPG 키를 장착하십시오.
wget -qO - https://artifacts.elastic.co/GPG-KEY-elasticsearch | sudo apt-key add -

리포지토리 추가
echo "deb https://artifacts.elastic.co/packages/7.x/apt stable main" | sudo tee -a /etc/apt/sources.list.d/elastic-7.x.list

패키지 정보 업데이트:
sudo apt-get update

Installing the Wazuh manager

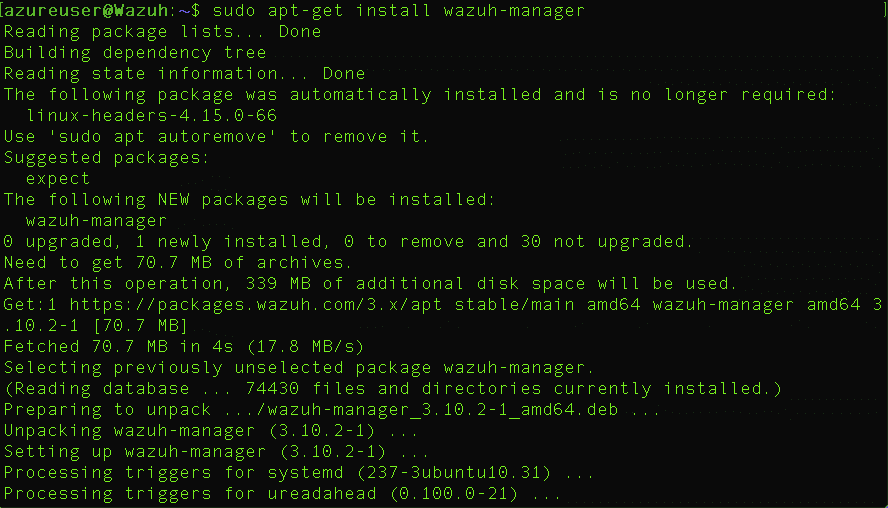
터미널에 Wazuh 관리자를 설치하십시오.
sudo apt-get install wazuh-manager

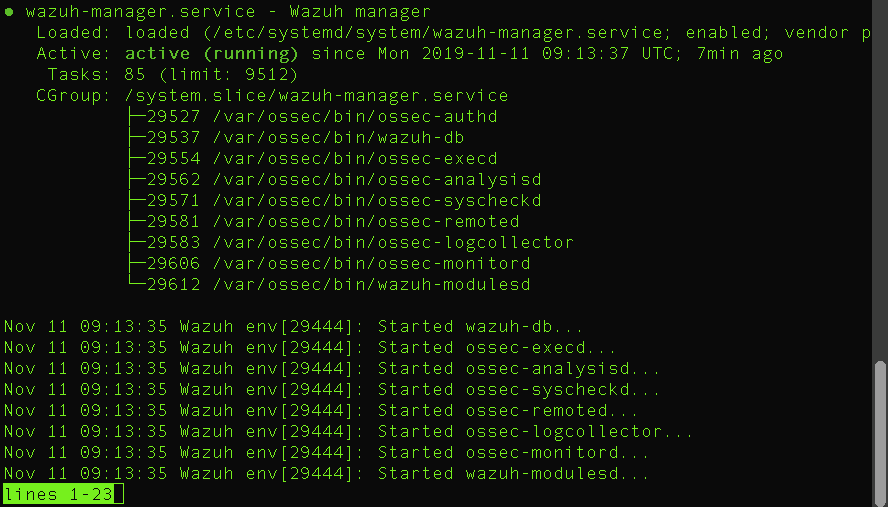
Once the process is completed, you can check the service status with:
service wazuh-manager status

Wazuh API 설치:
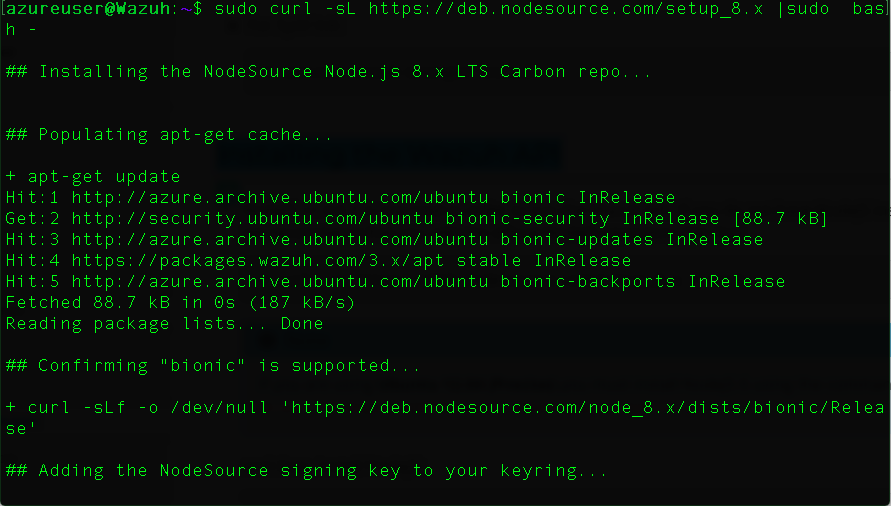
Wazuh API를 실행하기 위해서는 NodeJS \>= 4.6.1이 필요하다.
sudo curl -sL https://deb.nodesource.com/setup_8.x | sudo bash -

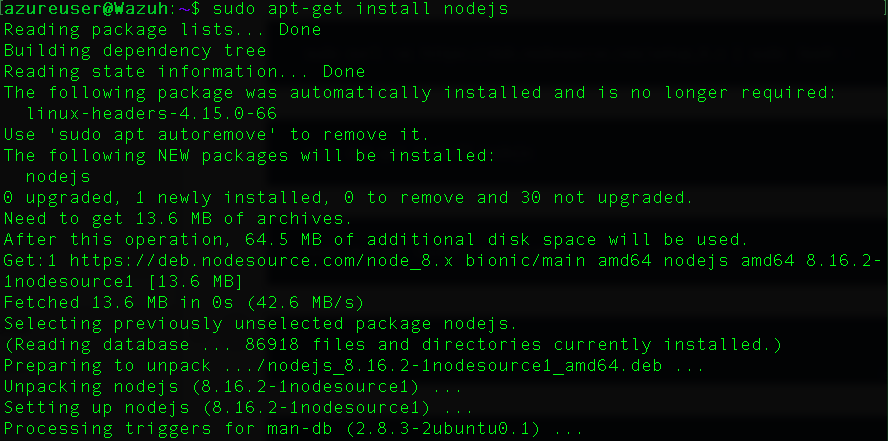
그런 다음 노드를 설치하십시오.JS:
sudo apt-get install nodejs

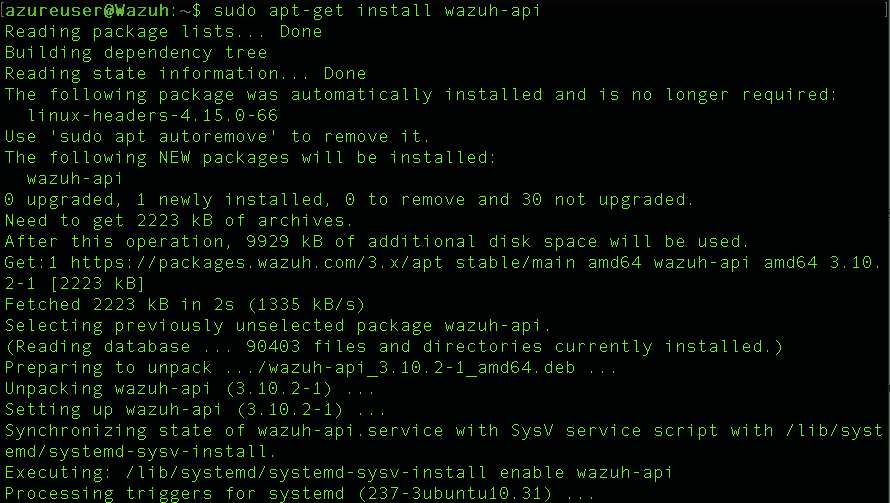
Wazuh API 설치:
sudo apt-get install wazuh-api

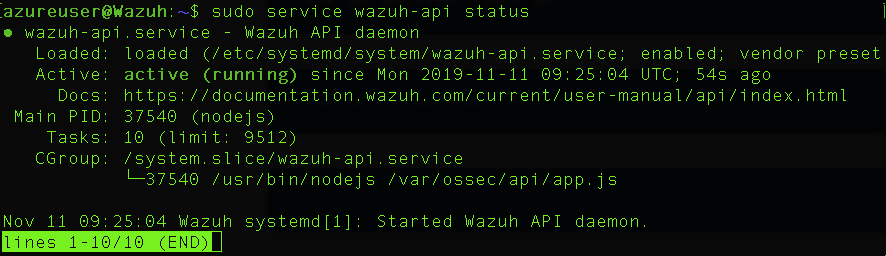
프로세스가 완료되면 다음을 통해 서비스 상태를 확인할 수 있다.
sudo service wazuh-api status

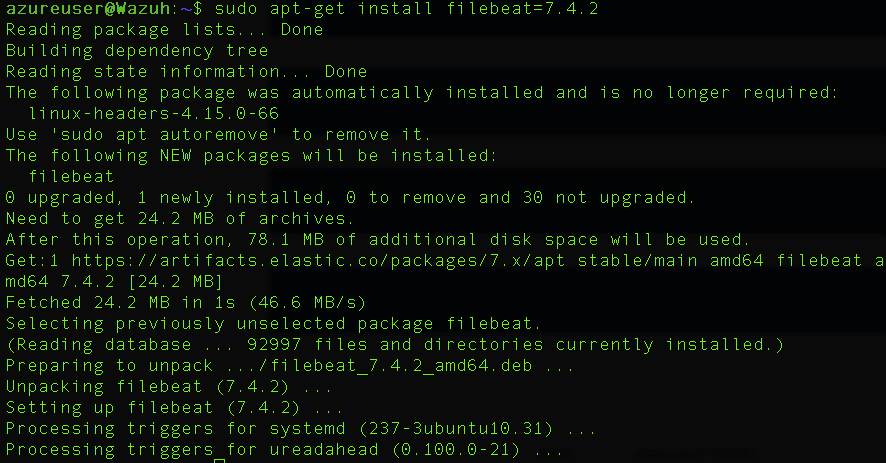
파일비트 설치
apt-get install filebeat=7.4.2

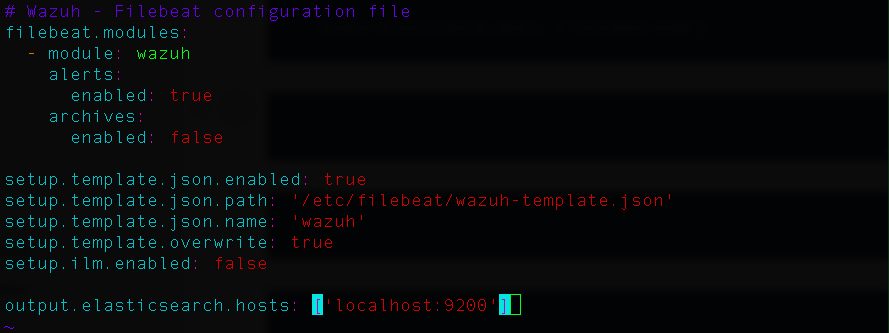
Elasticsearch로 Wazuh 경고를 전달하기 위한 사전 구성
curl -so /etc/filebeat/filebeat.yml https://raw.githubusercontent.com/wazuh/wazuh/v3.11.4/extensions/filebeat/7.x/filebeat.yml
Elasticsearch용 경고 템플릿 다운로드
curl -so /etc/filebeat/wazuh-template.json https://raw.githubusercontent.com/wazuh/wazuh/v3.11.4/extensions/elasticsearch/7.x/wazuh-template.json
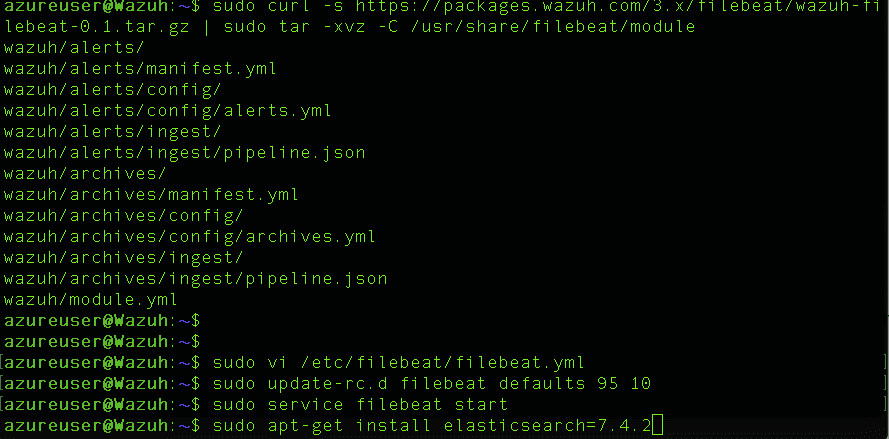
Filebeat용 Wazuh 모듈 다운로드:
curl -s https://packages.wazuh.com/3.x/filebeat/wazuh-filebeat-0.1.tar.gz | sudo tar -xvz -C /usr/share/filebeat/module

sudo vi /etc/filebeat/filebeat.yml

파일비트 서비스 활성화 및 시작:
sudo update-rc.d filebeat defaults 95 10
sudo service filebeat start
탄성 스택 설치

Elastic search는 강력한 오픈 소스 분산형 RESTful JSON 기반 검색 엔진이다.검색 서버로 볼 수 있다.NoSQL 데이터베이스 입니다.탄성 검색을 설치하려면 이미 Java가 설치되어 있는지 확인해야 한다.
sudo apt-get install elasticsearch=7.4.2
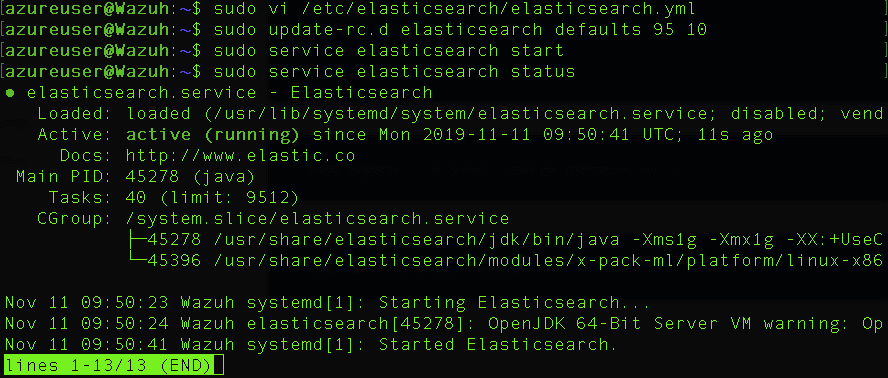
sudo vi /etc/elasticsearch/elasticsearch.yml
node.name: node-1 network.host: ["0.0.0.0"] http.port: 9200 discovery.seed_hosts: [] cluster.initial_master_nodes: ["node-1"]
sudo update-rc.d elasticsearch defaults 95 10
sudo service elasticsearch start

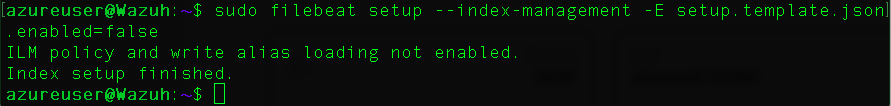
Elasticsearch가 실행되면 Filebeat 템플릿을 로드하는 것이 좋다. Filebeat가 설치된 곳에서 다음 명령을 실행하십시오.
sudo filebeat setup --index-management -E setup.template.json.enabled=false

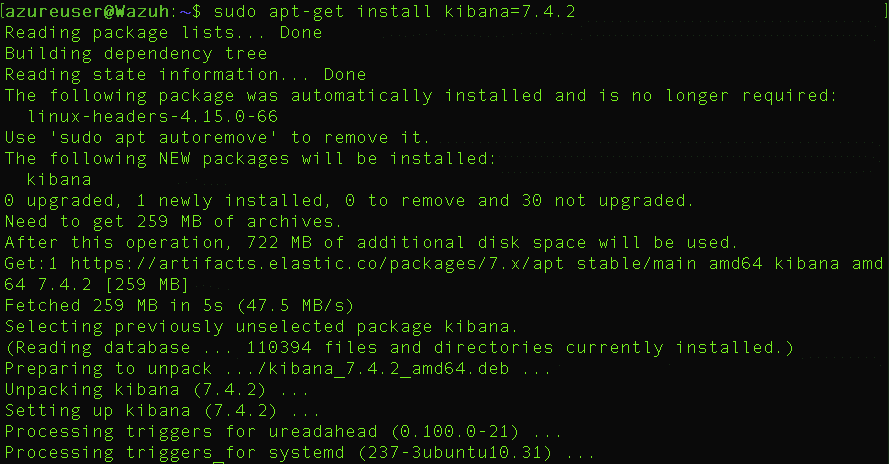
키바나 설치

키바나는 로그를 검색하고 시각화하기 위한 웹 인터페이스다. 그것은 데이터 로그 대시보드다. 파이 차트, 막대, 열 지도, 버블 차트, 산점도 등이 포함되어 있다. 데이터를 시각화하고 비정상적인 패턴을 감지하는 놀라운 솔루션
apt-get install kibana=7.4.2

키바나용 Wazuh 앱 플러그인 설치
sudo -u kibana bin/kibana-plugin install https://packages.wazuh.com/wazuhapp/wazuhapp-3.11.4_7.6.1.zip
sudo vi /etc/kibana/kibana.yml
server.port: 5601 server.host: 0.0.0.0 elasticsearch.hosts: ["http://localhost:9200"]
sudo update-rc.d kibana defaults 95 10
service kibana start
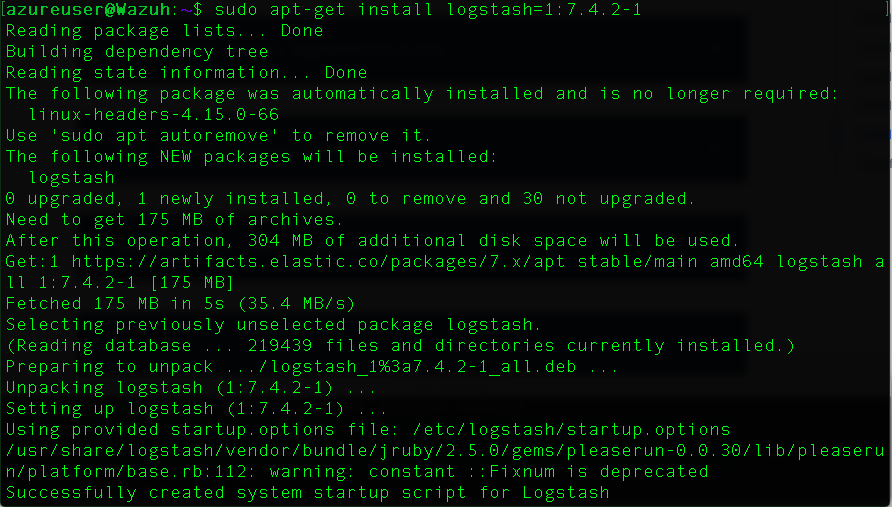
로그스타시를 사용하여 데이터 변환(옵션)

로그스타시는 로그를 수집, 파싱 및 변환하기 위한 오픈 소스다.
sudo apt-get install logstash=1:7.4.2-1
sudo systemctl daemon-reload
sudo systemctl enable logstash

Logstash용 Wazuh 구성 파일 다운로드
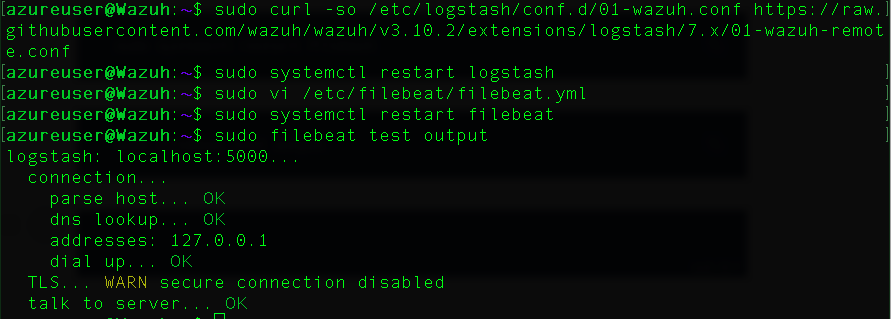
sudo systemctl restart logstash
sudo vi /etc/filebeat/filebeat.yml\</a
파일비트 인스턴스를 구성하고 이벤트 대상을 Elasticsearch 인스턴스에서 Logstash 인스턴스로 변경하십시오.
Elasticsearch 출력 사용 안 함:
추가:
output.logstash.properties: ["localhost:properties"]
sudo systemctl 재시작 파일비트
Filebeat에서 Logstash에 연결할 수 있는지 확인하십시오.
sudo 파일비트 테스트 출력
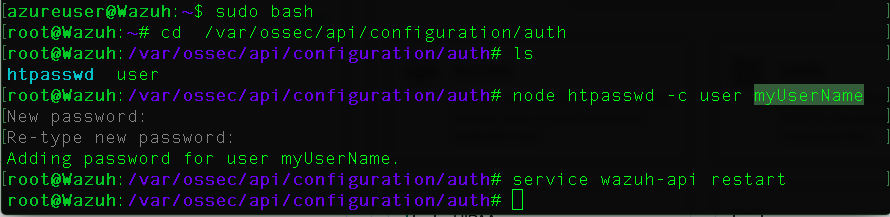
기본 자격 증명을 원하는 사용자 이름으로 바꾸십시오. 여기서 myUsername은 Wazuh API를 보호하십시오.
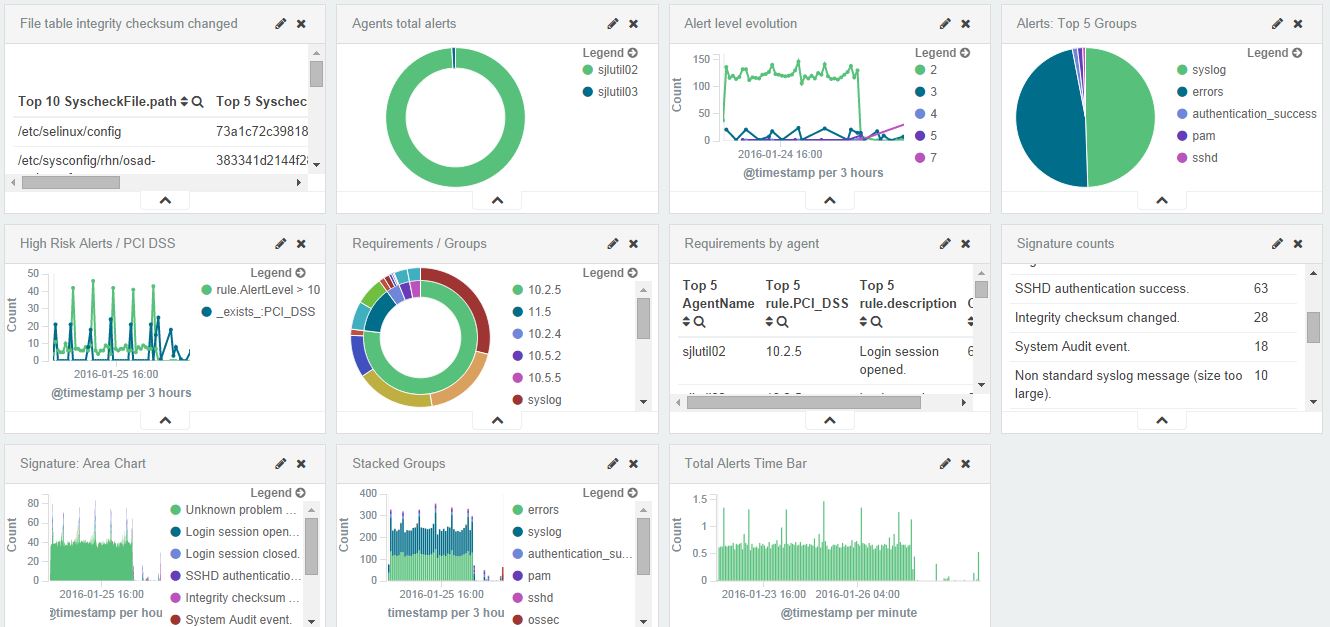
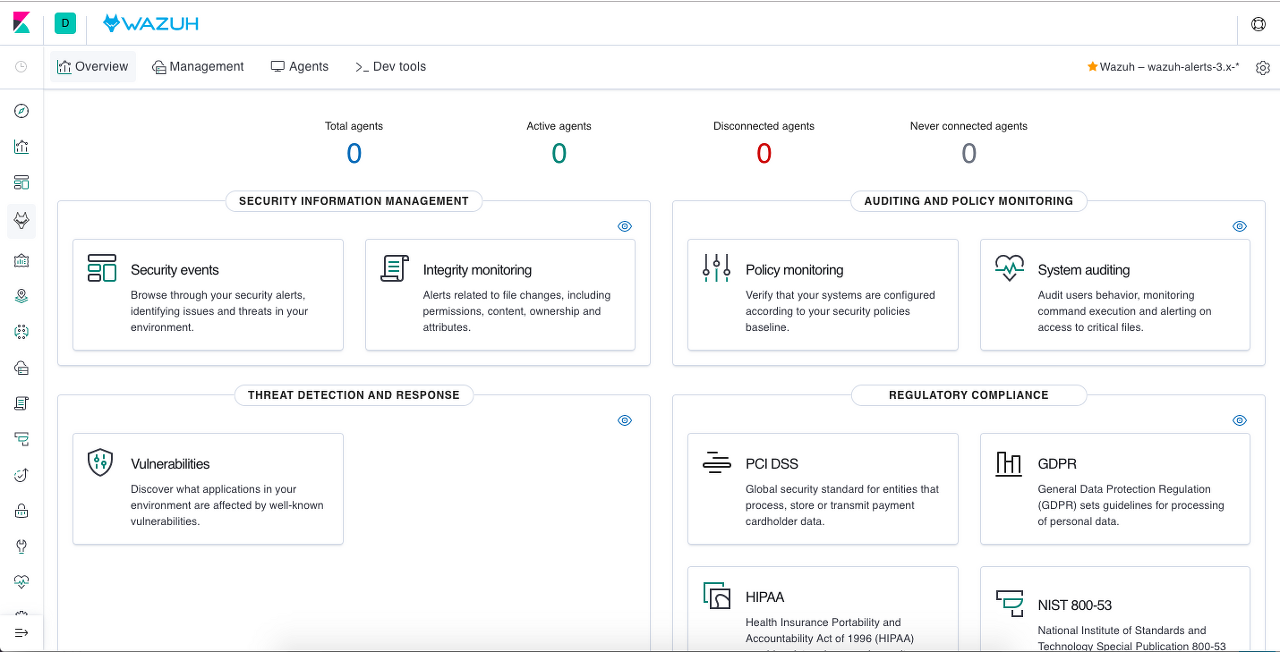
웹 브라우저를 열고 포트 5601(기본 키바나 포트)의 Elastic Stack 서버의 IP 주소로 이동하십시오. 그런 다음 왼쪽 메뉴에서 와즈 앱으로 이동하십시오.
"Add new API"(새 API 추가)를 클릭하고 API 필드를 채운다. 모든 일이 잘 풀리면, 이 메인 와즈 대시보드를 받게 될 거야.

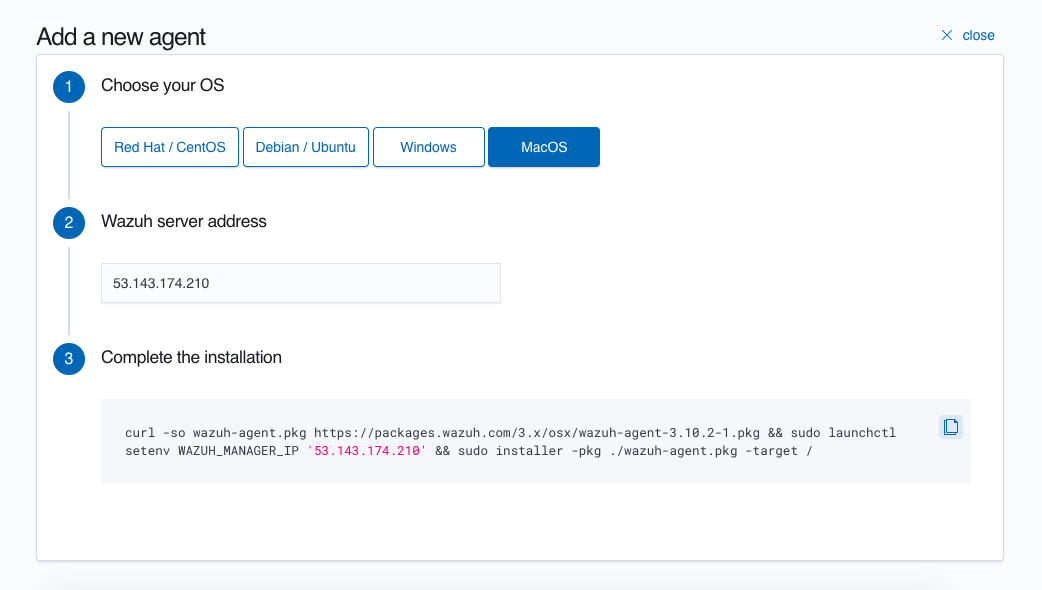
새 에이전트를 추가하려면 OS를 선택하고 패키지를 컬링한 후 설치하십시오.

Hands-on Wazuh Host-based Intrusion Detection System (HIDS) Deployment
Hi Peerlysters,
In this article we are going to learn how to deploy a powerful HIDS called "Wazuh"
What is an intrusion detection system?
Intrusion detection systems are a set of devices or pieces of software that play a huge role in modern organizations to defend against intrusions and malicious activities.We have two major intrusion detection system categories:
- Host Based Intrusion Detection Systems (HIDS): they run on the enterprise hosts to detect host attacks
- Network Based Intrusion Detection Systems (NIDS): their role is to detect network anomalies by monitoring the inbound and outbound traffic.
The detection can be done using two intrusion detection techniques:
- Signature based detection technique: the traffic is compared against a database of signatures of known threats
- Anomaly-based intrusion technique: inspects the traffic based on the behavior of activities.
How to Deploy Wazuh HIDS?

According to its official website: https://wazuh.com
Wazuh is a free, open source and enterprise-ready security monitoring solution for threat detection, integrity monitoring, incident response and compliance. Wazuh is used to collect, aggregate, index and analyze security data, helping organizations detect intrusions, threats and behavioral anomalies.
Wazuh is used to collect, aggregate, index and analyze security data, helping organizations detect intrusions, threats and behavioral anomalies.
It contains the following components:
- Wazuh server
- Elastic Stack
- Wazuh agent
Now let's explore how to deploy it. For the demonstration i am using a Ubuntu 18.04 VM.
sudo apt-get update
sudo apt-get installcurl apt-transport-https lsb-release gnupg2
Install the GPG key:
wget -qO - https://artifacts.elastic.co/GPG-KEY-elasticsearch | sudo apt-key add -

Add the repository
echo "deb https://artifacts.elastic.co/packages/7.x/apt stable main" | sudo tee -a /etc/apt/sources.list.d/elastic-7.x.list

Update the package information:
sudo apt-get update
Installing the Wazuh manager

On your terminal, install the Wazuh manager:
sudo apt-get install wazuh-manager
Once the process is completed, you can check the service status with:
service wazuh-manager status
Installing the Wazuh API:
NodeJS \>= 4.6.1 is required in order to run the Wazuh API.
sudo curl -sL https://deb.nodesource.com/setup_8.x | sudo bash -
and then, install NodeJS:
sudo apt-get install nodejs
Install the Wazuh API:
sudo apt-get install wazuh-api
Once the process is complete, you can check the service status with:
sudo service wazuh-api status
Installing Filebeat
apt-get install filebeat=7.4.2
This is pre-configuration to forward Wazuh alerts to Elasticsearch
curl -so /etc/filebeat/filebeat.yml https://raw.githubusercontent.com/wazuh/wazuh/v3.11.4/extensions/filebeat/7.x/filebeat.yml
Download the alerts template for Elasticsearch
curl -so /etc/filebeat/wazuh-template.json https://raw.githubusercontent.com/wazuh/wazuh/v3.11.4/extensions/elasticsearch/7.x/wazuh-template.json
Download the Wazuh module for Filebeat:
curl -s https://packages.wazuh.com/3.x/filebeat/wazuh-filebeat-0.1.tar.gz | sudo tar -xvz -C /usr/share/filebeat/module
sudo vi /etc/filebeat/filebeat.yml
Enable and start the Filebeat service:
sudo update-rc.d filebeat defaults 95 10
sudo service filebeat start
Installing Elastic Stack

Elasticsearch is a powerful open source distributed, RESTful, JSON-based search engine.You can see it as a search server.It is a NoSQL database.To install elasticsearch we need to make sure that we are already installed Java.
sudo apt-get install elasticsearch=7.4.2
sudo vi /etc/elasticsearch/elasticsearch.yml
node.name: node-1 network.host: ["0.0.0.0"] http.port: 9200 discovery.seed_hosts: [] cluster.initial_master_nodes: ["node-1"]
sudo update-rc.d elasticsearch defaults 95 10
sudo service elasticsearch start
Once Elasticsearch is up and running, it is recommended to load the Filebeat template. Run the following command where Filebeat was installed:
sudo filebeat setup --index-management -E setup.template.json.enabled=false
Installing Kibana

Kibana is a Web interface for searching and visualizing logs. It is a data-log dashboard. It contains pie charts, bars, heat maps, bubble charts and scatter plots. It is an amazing solution to visualize your data and detect any unusual patterns
apt-get install kibana=7.4.2
Install the Wazuh app plugin for Kibana
sudo -u kibana bin/kibana-plugin install https://packages.wazuh.com/wazuhapp/wazuhapp-3.11.4_7.6.1.zip
sudo vi /etc/kibana/kibana.yml
server.port: 5601 server.host: 0.0.0.0 elasticsearch.hosts: ["http://localhost:9200"]
sudo update-rc.d kibana defaults 95 10
service kibana start
Transform data with Logstash (Optional)

Logstash is an open source to collect,parse and transform logs.
sudo apt-get install logstash=1:7.4.2-1
sudo systemctl daemon-reload
sudo systemctl enable logstash
Download the Wazuh configuration file for Logstash
sudo systemctl restart logstash
sudo vi /etc/filebeat/filebeat.yml\</a
Configure the Filebeat instance, change the events destination from Elasticsearch instance to the Logstash instance.
Disable Elasticsearch Output:
Add:
output.logstash.hosts: ["localhost:5000"]
sudo systemctl restart filebeat
Check if Logstash is reachable from Filebeat.
sudo filebeat test output

Replace the default credentials with your desired username where myUsername is shown below to protect your Wazuh API

More information: https://documentation.wazuh.com/3.3/installation-guide/installing-elastic-stack/connect_wazuh_app.html
Open a web browser and go to the Elastic Stack server's IP address on port 5601 (default Kibana port). Then, from the left menu, go to the Wazuh App.
Click on "Add new API" and fill the API fields. If everything goes fine, you will get this main Wazuh dashboard.
To add new agent just select the OS, curl the package and install it:
※ 출처 : Blue Teams Academy | www.blueteamsacademy.com/wazuh/
'OffSec' 카테고리의 다른 글
| [Blue Teams Academy] 모듈 7 - 인시던트 관리 내 Hive 프로젝트를 설치하고 사용하는 방법 (0) | 2021.03.18 |
|---|---|
| [Blue Teams Academy] 모듈 6 - 위협 인텔리전스 기본 원리 (0) | 2021.03.18 |
| [Blue Teams Academy] 모듈 4 - Microsoft Azure Sentinel(Cloud-Native SIEM 및 SAWM) 사용 시작 (0) | 2021.03.18 |
| [Blue Teams Academy] 모듈 3 - ELK(Elastic Stack) SIEM을 배포하는 방법 (2) | 2021.03.18 |
| [Blue Teams Academy] 모듈 2 - 모든 Blue Teamer가 갖춰야 하는 20가지 오픈 소스 도구 (0) | 2021.03.18 |


댓글