보안 정보 및 이벤트 관리 시스템(SIEM)은 사고 대응 임무에서 매우 중요한 도구다. 모든 보안 운영 센터에는 SIEM이 설치되어 있다. 이 기사에서는 ELK(Elastic Stack)라는 놀라운 제품군을 사용하여 완전히 작동하는 SIEM을 구축하는 방법에 대해 알아보려고 한다.

이미지 원본: 대시보드
이 기사에서는 다음 사항을 살펴보기로 한다.
- 탄성 스택이란?
- Elastic stack 설치 방법?
- Elasticsearch를 설치하는 방법?
- 키바나 설치 방법?
- 로그스트래치 설치 방법?
- 엘크 비트를 배치하는 방법: 미터법 비트
- 감사비트를 디폴링하는 방법
- 엘크 SIEM 배치 방법
SIEM을 구축하기 위해 필요한 단계를 깊이 연구하기 전에, 다양한 엘크 구성 요소에 대한 공정한 이해를 확보하는 것이 필수적이다.
엘크 스택이란?
이미지 원본: 엘크
ELK Stack은 "Elasticsearch Logstash Kibana" Stack의 약칭이다. 그들은 세 가지 오픈소스 프로젝트다. 이 스택은 매달 50만 건씩 다운로드되는 세계에서 가장 인기 있는 로그 관리 플랫폼 중 하나이다. 엘케이(LK) 스택은 비즈니스 인텔리전스, 보안 및 컴플라이언스, 웹 분석 등을 제공하기 때문에 정보기술(IT) 사업에 널리 활용되고 있다.
시작해보자;
SIEM을 구축하려면 다음과 같은 필수 라이브러리와 프로그램을 설치해야 한다.
시연을 위해 나는 마이크로소프트 Azure에 호스팅된 Ubuntu 18.04 서버를 사용했다.
source.list 파일 업데이트:
sudo apt update
Java JDK 8 설치(Debian을 사용하는 경우 apt-transport-https)
sudo apt install -y openjdk-8-jdk
다음을 사용하여 Java 버전 확인:
java -version
이제 Elasticsearch 설치:
wget -qO - https://artifacts.elastic.co/GPG-KEY-elasticsearch | sudo apt-key add -
echo "deb https://artifacts.elastic.co/packages/7.x/apt stable main" | sudo tee -a /etc/apt/sources.list.d/elastic-7.x.list
sudo apt update
sudo apt install elasticsearch
탄성 검색을 설치한 후 /etc/탄성 검색/탄성 검색.yml 파일을 수정하여 구성해야 함
sudo vi /etc/elasticsearch/elasticsearch.yml
대화 해제 네트워크.host 및 http.port에 값을 할당한다. 프로덕션 서버에서 "0.0.0"을 사용하지 마십시오. 나는 단지 시범을 위해 그것을 사용하고 있다.
파일을 저장하다
부팅 시 Elasticsearch를 시작하려면 다음을 입력하십시오.
sudo update-rc.d elasticsearch defaults 95 10
탄력 검색 서비스 시작:
sudo service elasticsearch start
장착 상태를 점검하십시오.
curl -X GET "YOU_IP:9200"
이제 키바나 설치:
sudo apt install -y kibana
탄력적인 검색을 통해 한 것처럼 우리도 이를 구성해야 한다.
sudo vi /etc/kibana/kibana.yml
다음 값 설명 해제 및 수정:
server.port: 5601 server.host: "YOUR-IP-HERE" elasticsearch.url: "http://YOUR-IP-HERE:9200"
파일을 저장하고 이전에 수행한 작업 수행
sudo update-rc.d kibana defaults 95 10
실행:
sudo service kibana start
이제 https://YOUR-IP-여기:5601로 이동하십시오.
Vaila, 미리 설치된 일부 샘플 로그 데이터의 대시보드 탐색 시작:
필요한 경우 로그를 수집, 구문 분석 및 변환할 로그스트래시를 설치하십시오.
sudo apt install -y logstash
하지만 어떻게 하면 우리 자신의 데이터를 사용할 수 있을까?
좋은 질문이야, 우리가 "비츠"라고 부르는 것을 이용해서 호스트로부터 데이터를 받을 수 있어. 전체 목록은 다음에서 확인하십시오.
시범으로 나는 "Metricbeat"를 사용할 것이다.
sudo apt-get install metricbeat
입력하여 비트 구성
sudo vi /etc/metricbeat/metricbeat.yml
평소와 같이 부팅할 때 메트릭 비트를 시작하려면 다음과 같이 하십시오.
sudo update-rc.d metricbeat defaults 95 10
비트 시작:
sudo service metricbeat start
이제 기본 대시보드로 이동하여 새 인덱스를 만드십시오.
모든 일이 잘 풀리면 박자를 볼 수 있을 것이다.
@timestamp를 선택하여 시간 필터를 선택하십시오.
그런 다음, 원하는 데이터를 그 비트로부터 시각화할 수 있다.
지금쯤 우리는 가장 중요한 부품을 배치했다. 엘크 SIEM 구축 방법에 대해 알아봅시다.
사이드바로 이동하면 SIEM 옵션:
SIEM의 주요 페이지로 이동:
하지만 이제 우리는 SIEM을 실행하기 위한 데이터가 필요하다. 그러기 위해서는 다음과 같은 출처의 다른 비트를 설치할 필요가 있다.
데모에서는 "감사 비트"를 사용할 것이다.
sudo apt-get install auditbeat
구성 기준:
sudo vi /etc/auditbeat/auditbeat.yml
설정을 확인하십시오.
sudo auditbeat setup
비트 실행:
sudo service auditbeat start
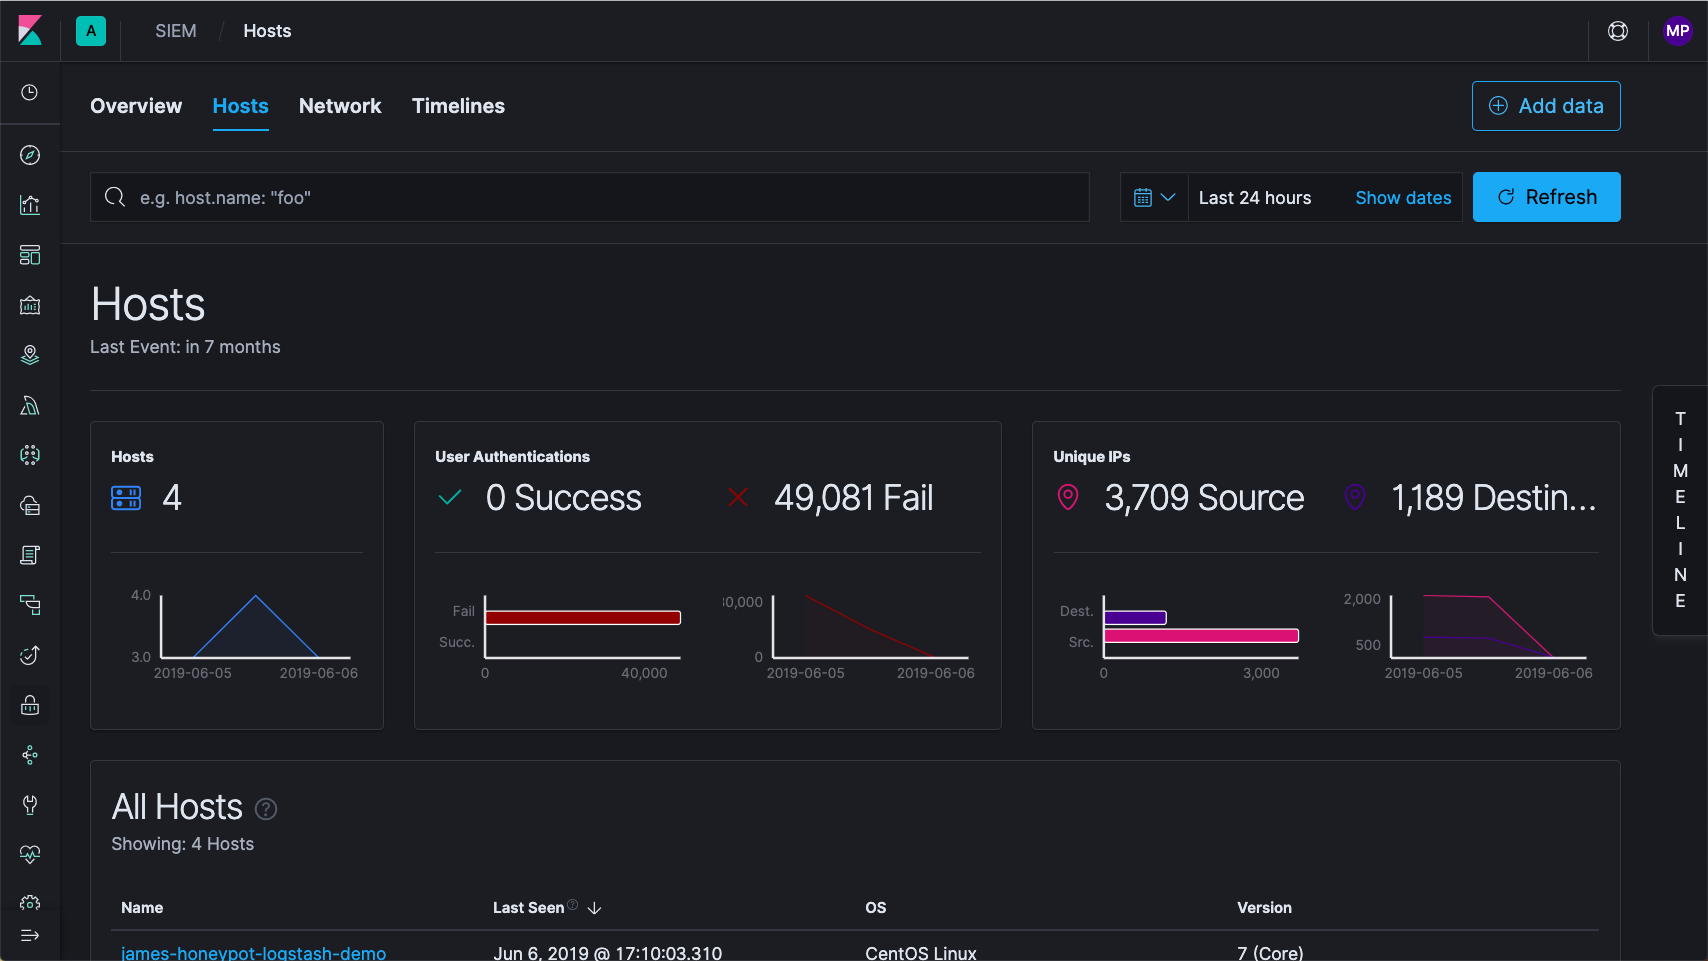
모든 작업을 올바르게 수행한 경우 SIEM Dashboard에 다음 내용이 표시됨:
축하합니다! 이제 SIEM의 대시보드를 볼 수 있다.
호스트 확인:
네트워크 대시보드 확인:
시스템 개요:
Vaila, 엘크 SIEM을 만드는 방법을 배웠구나.
Detailed Guide: How to deploy your Elastic Stack (ELK) SIEM
Security information and event management systems (SIEM) are very important tools in incident response missions. Every security operation centre is equipped with a SIEM. In this article, we are going to learn how to deploy a fully working SIEM using the amazing suite the Elastic stack (ELK).
Image source: dashboard
In this article we are going to explore the following points:
- What is Elastic stack?
- How to install Elastic stack?
- How to install Elasticsearch?
- How to install kibana?
- How to install logstach?
- How to deploy ELK beats: Metricbeat
- How to deply Auditbeat
- How to deploy an ELK SIEM
Before diving deep into the required steps to build a SIEM, it is essential to acquire a fair understanding of the different ELK components.
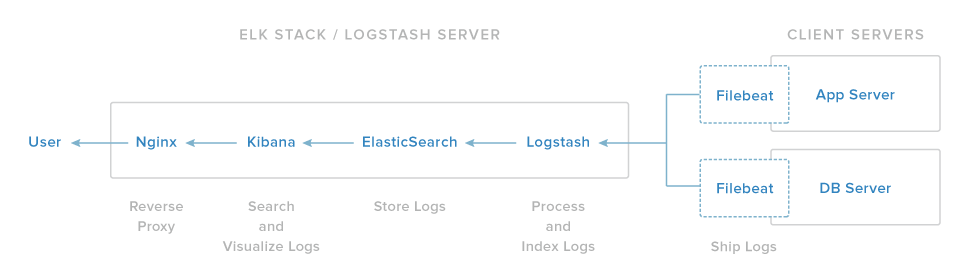
What is the ELK Stack?
Image source: ELK
ELK Stack is the abbreviated form of "Elasticsearch Logstash Kibana" Stack. They are three open source projects. This stack is one of the world's most popular log management platforms by 500,000 downloads every month. The ELK stack is widely used in information technology businesses because it provides business intelligence, security and compliance, and web analytics.
Let's get started;
To build the SIEM, you need to install the required libraries and programs:
For the demonstration, I used a Ubuntu 18.04 server hosted on Microsoft Azure
Update the sources.list file:
sudo apt update
Install Java JDK 8 (and apt-transport-https if you are using Debian)
sudo apt install -y openjdk-8-jdk
Check the Java version with:
java -version
Now let's install Elasticsearch:
wget -qO - https://artifacts.elastic.co/GPG-KEY-elasticsearch | sudo apt-key add -
echo "deb https://artifacts.elastic.co/packages/7.x/apt stable main" | sudo tee -a /etc/apt/sources.list.d/elastic-7.x.list
sudo apt update
sudo apt install elasticsearch
After installing elasticsearch you need to configure it by modifying /etc/elasticsearch/elasticsearch.yml file
sudo vi /etc/elasticsearch/elasticsearch.yml
Un-comment network.host and http.port and assign values to them. Don't use "0.0.0.0" in your production servers. I am using it just for a demonstration.
save the file.
To start Elasticsearch on boot up type:
sudo update-rc.d elasticsearch defaults 95 10
Start elasticsearch service:
sudo service elasticsearch start
Check the installation:
curl -X GET "YOU_IP:9200"
Now let's install Kibana:
sudo apt install -y kibana
And like what we did with elasticsearch we need to configure it too:
sudo vi /etc/kibana/kibana.yml
Un-comment and modify the following values:
server.port: 5601 server.host: "YOUR-IP-HERE" elasticsearch.url: "http://YOUR-IP-HERE:9200"
Save the file, and perform what we did previously
sudo update-rc.d kibana defaults 95 10
and run it:
sudo service kibana start
Now go to https://YOUR-IP-HERE:5601
Voila, you can start exploring the dashboard of some pre-installed Sample Log data:
Install logstash to collect, parse and transform logs if needed:
sudo apt install -y logstash
But wait how can we use our own data?
It is a good question, we can receive data from a host using what we call "Beats". You can find the full list here:
As a demonstration i am going to use "Metricbeat
sudo apt-get install metricbeat
Configure the beat by typing
sudo vi /etc/metricbeat/metricbeat.yml
To start metricbeat on boot up type as usual
sudo update-rc.d metricbeat defaults 95 10
Start the beat:
sudo service metricbeat start
Now go to the main dashboard and create a new index:
If everything went well you will see your beat:
Select the time filter by selecting @timestamp:
Then, you can visualize any data you want from that beat.
By now we deployed the most important parts. Let's learn how to deploy the ELK SIEM:
Go to the sidebar and you will find SIEM option:
It will take you to the main SIEM page:
But now we need data to run the SIEM. In order to do that we need to install other beats from sources like the following:
For the demonstration i am going to use the " Auditbeat":
sudo apt-get install auditbeat
Configure it by:
sudo vi /etc/auditbeat/auditbeat.yml
Check the setup:
sudo auditbeat setup
Run the beat:
sudo service auditbeat start
If you did everything correctly you will see this on the SIEM Dashboard:
Congratulations! Now you can see the dashboard of your SIEM.
Check the hosts:
Check the Network Dashboard:
A system Overviews:
Voila, you learned how to build an ELK SIEM.
※ 출처 : Blue Teams Academy | www.blueteamsacademy.com/elk/


댓글